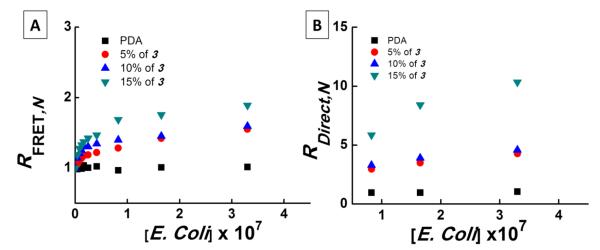
Figure 5.
(A) RFRET for N series liposome at different E. Coli concentrations. RFRET represents the ratio of SR-101 emission intensity (excitation wavelength was 560 nm) after addition of E. Coli of a given concentration to SR-101 emission intensity in the absence of E. Coli. (B) RDirect at different E. Coli concentrations. RDirect represents the ratio of PDA emission intensity (excitation wavelength was 490 nm) in the presence and absence of E. Coli. The excitation wavelengths for FRET and direct excitation were 560 nm and 490 nm respectively.

