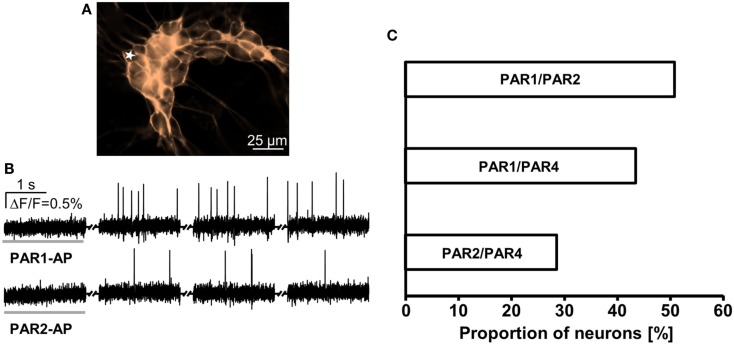
Figure 3.
Response pattern to PAR-APs in guinea pig cultured myenteric neurons demonstrates receptor clustering. (A) Image shows outlines of a cluster of guinea pig cultured myenteric neurons stained with the voltage sensitive dye Di-8-ANEPPS. (B) Representative traces of a neuron [marked with a star in (A)] that responded to PAR1-AP and PAR2-AP (2 s spritz application indicated by a gray horizontal bar). Recordings were made in four 2 s long recording periods with 5–6 s intervals in between (indicated by the symbol between the traces). Every peak represents an action potential. (C) Pairwise application of PAR-APs revealed functional coexpression patterns. Proportions of neurons responding to two PAR-APs are expressed relative to the proportion of neurons responding to any PAR-AP in that particular set of experiment (100%).

