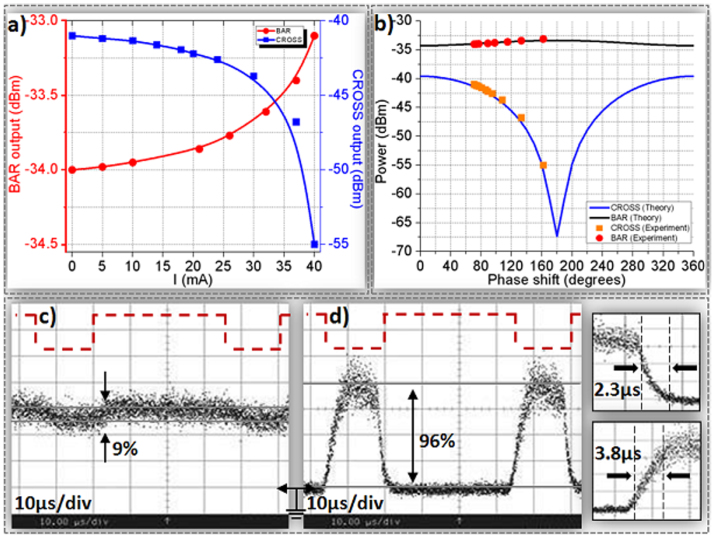
Figure 3. CW injection.
(a) Static TO transfer functions for the CROSS and BAR output ports of the A-MZI, (b) theoretically calculated transfer function for the CROSS and BAR output ports of a symmetric MZI showing the region confirmed by the experimentally obtained transfer function of the A-MZI, (c) BAR output TO modulation, (d) CROSS output TO modulation and rise/fall times (insets). Dashed red lines in (c) and (d) show the corresponding electrical control signal.

