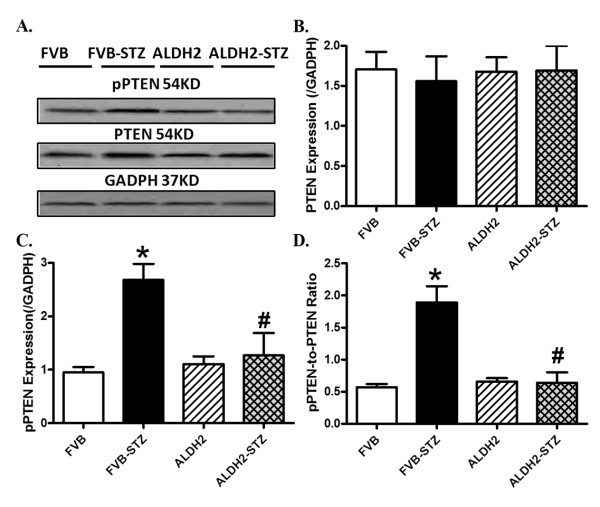
Figure 10.
Total and phosphorylated PTEN in myocardium from FVB and ALDH2 mice treated with or without streptozotocin. (A) Representative gel blots of pan and phosphorylated PTEN and GAPDH (used as loading control) using specific antibodies; (B) pan PTEN expression; (C) pPTEN levels; (D) pPTEN-to-PTEN ratio. Mean ± SEM, n = 6 mice per group. *P < 0.05 versus FVB group; #P < 0.05 versus FVB-STZ group.

