
Figure 3.
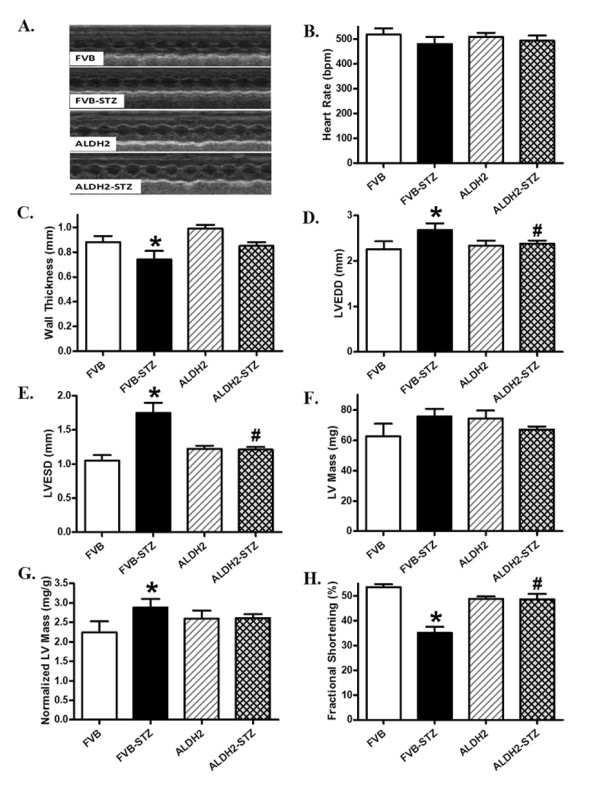
Echocardiographic properties in FVB and ALDH2 transgenic mice treated with or without streptozotocin. (A) Representative echocardiographic images; (B) heart rate; (C) wall thickness; (D) left ventricular (LV) end-diastolic diameter; (E) LV end-systolic diameter; (F) LV mass; (G) LV mass normalized to body weight; (H) fractional shortening. Mean ± SEM, n = 12 to 13 mice per group. *P <0.05 versus FVB group; #P <0.05 versus FVB-STZ group.