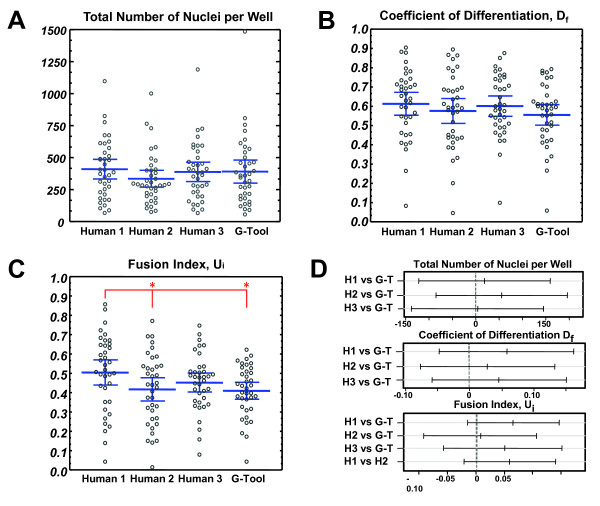
Figure 3.
Manual vs G-Tool counting. (A) Number of nuclei per colony, counted manually by three different individuals, and compared to G-Tool. Blue bars represent mean and 95% confidence intervals. (B) Coefficient of differentiation, Df, counted as in (A). Blue bars represent mean and 95% confidence intervals. (C) Fusion index, Ui, counted as in (A). Blue bars represent mean and 95% confidence intervals. Pairwise paired t test results: human 1 vs human 2 (P value = 4E-4)*, human 1 vs human 3 (P value = 0.22), human 1 vs G-Tool (P value = 6E-4)*, human 2 vs human 3 (P value = 0.40), human 2 vs G-Tool (P value = 0.77), human 3 vs G-Tool (P value = 0.22). *Paired t test shows a statistically significant difference between means at 95% confidence interval. (D) Statistical analysis: the differences between G-Tool and humans 1 to 3 is not statistically significant for eight of nine parameters. Tukey pairwise comparison test is shown comparing G-Tool counting to human counting for the total number of nuclei per well, the coefficient of differentiation, and the fusion index. If the pairwise range contains zero, the difference between the pair is not statistically significant. Blue bars represent mean and 95% confidence intervals. By Shapiro-Wilke test, data for Df and Ui were found to be normally distributed while number of nuclei showed a slight deviation from normality. We performed analysis of variance (ANOVA) and Tukey honestly significant difference (HSD) test on square root-transformed number of nuclei data and found that the same results were obtained with this normalized data set.

