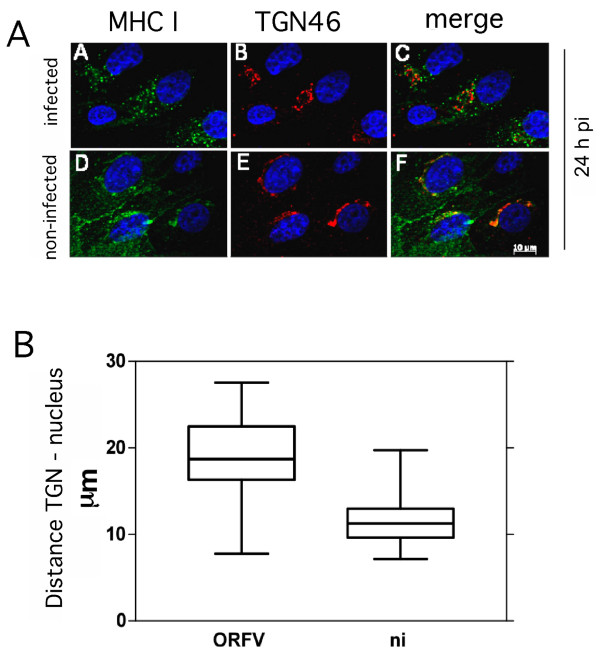
Figure 4.
Structural changes of the trans-Golgi network (TGN) after ORFV infection. (A) Infected cells (m.o.i. 0.5) or non-infected cells were fixed 24 hpi and stained with W6/32 antibody (green) and anti-TGN46 antibody (red) (panels A-F). Partial co-localization of MHC I and TGN can be seen in infected cells by merging the fluorescent images (merge). Nuclei are stained blue by DAPI. After infection TGN lost its perinuclear location and moved into the cytoplasm. A representative result of confocal fluorescence microscopy of three experiments is shown. (B) TGN-dislocation in ORFV infected cells. The distances of the TGN and the nucleus in infected and non-infected cells were quantified using with AxioVision Rel. 4.8 software (Zeiss). The evaluation of 27 infected and 27 non-infected cells is summarized as box plots and demonstrates an increased distance between TGN and cell nucleus in infected cells.

