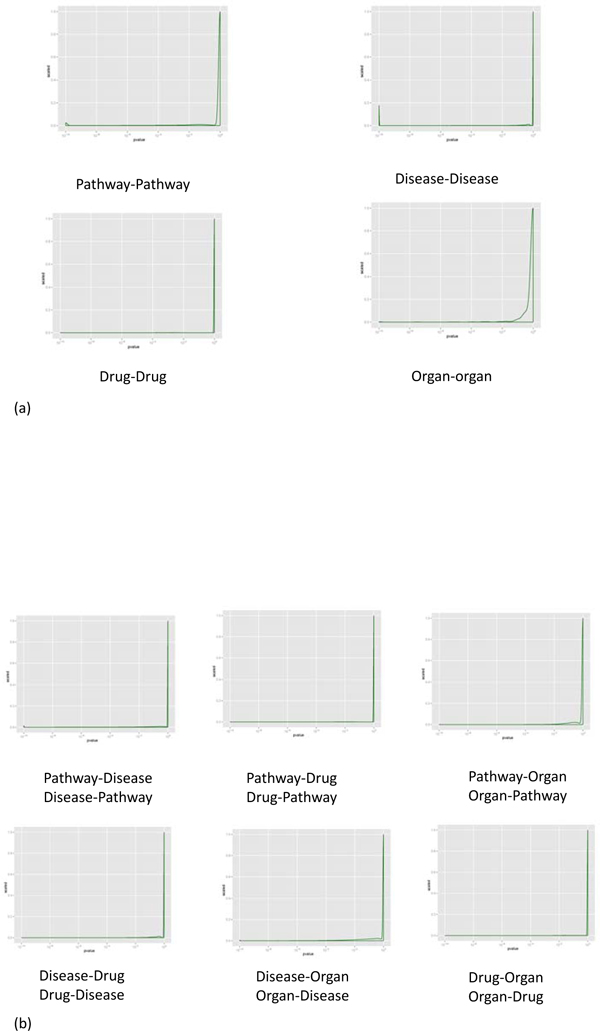
Figure 2.
p-value Distribution of Inter-association. The y-axis is the scaled density of p-value which is calculated by Fisher Exact test. (a) p-value Distribution of Inter-association between pathway-pathway, disease-disease, drug-drug, and organ-organ. (b) p-value Distribution of Inter-association between pathway, disease, drug, and organ.

