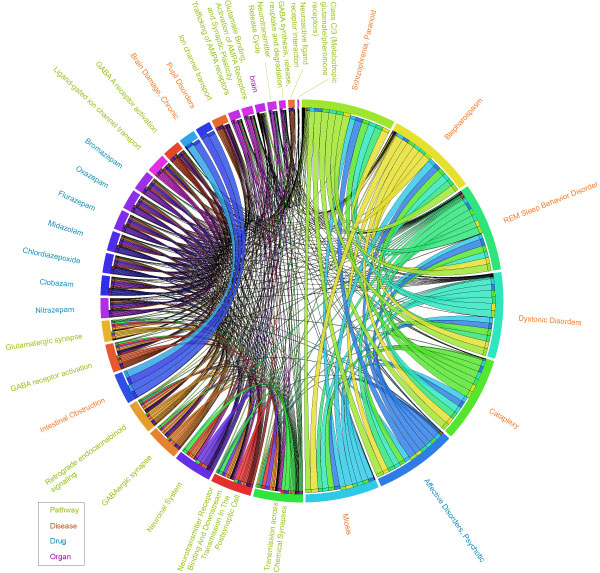
Figure 6.
A Circular View of the Inter-association Analysis of 369 Brain-Specific Markers. The text colors for the four components: pathway, disease, drug, and organ are palegreen, Chocolate, royalblue, and magenta, respectively. Links with variable thickness represent the extent of association between two components which is 1 minus log10 of p-value. The direction of association (A->B) is represented by a ribbon's end touching A and its other end not touching B.

