Figure 1.

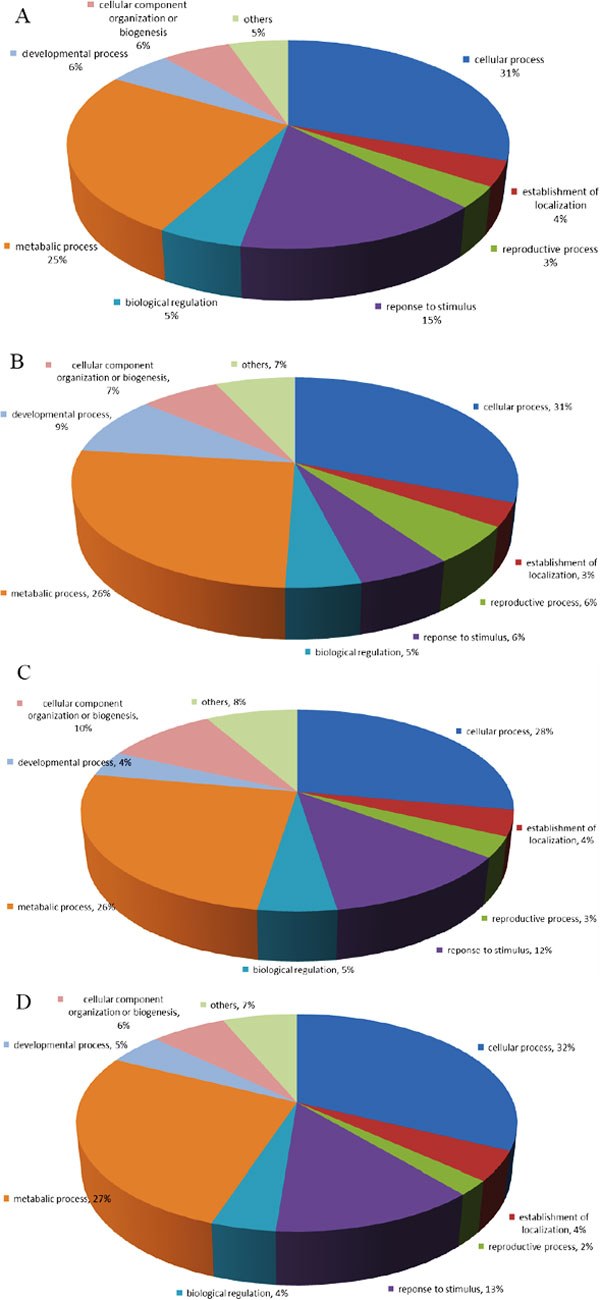
Pie charts of GO distribution of up-regulated and down-regulated proteins in zeatin (A and C) and BR (B and D) treated Arabidopsis according to their biological process.

Pie charts of GO distribution of up-regulated and down-regulated proteins in zeatin (A and C) and BR (B and D) treated Arabidopsis according to their biological process.