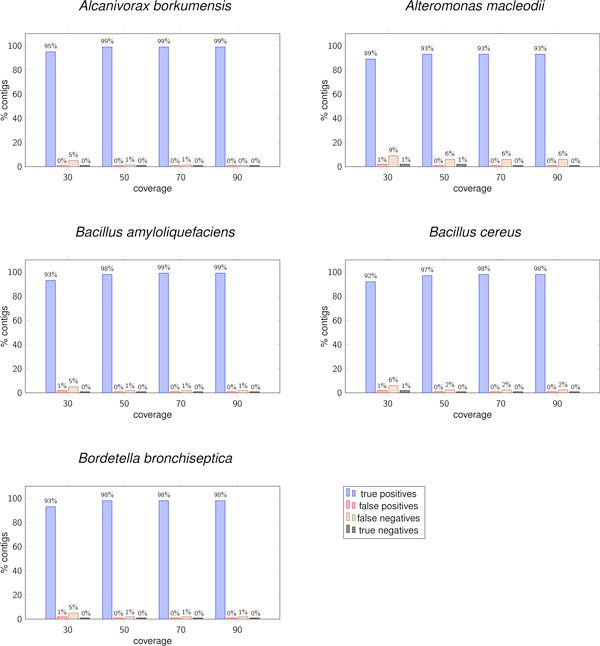
Figure 5.
Results on 5 simulated datasets. The five histograms represent, for each dataset, the true positives, false positives, false negatives, and true negatives rates for different input coverages. In order to decide if a (positive or negative) contig is either true or false, it is aligned against the reference on the exact positions in which it is supposed to occur.

