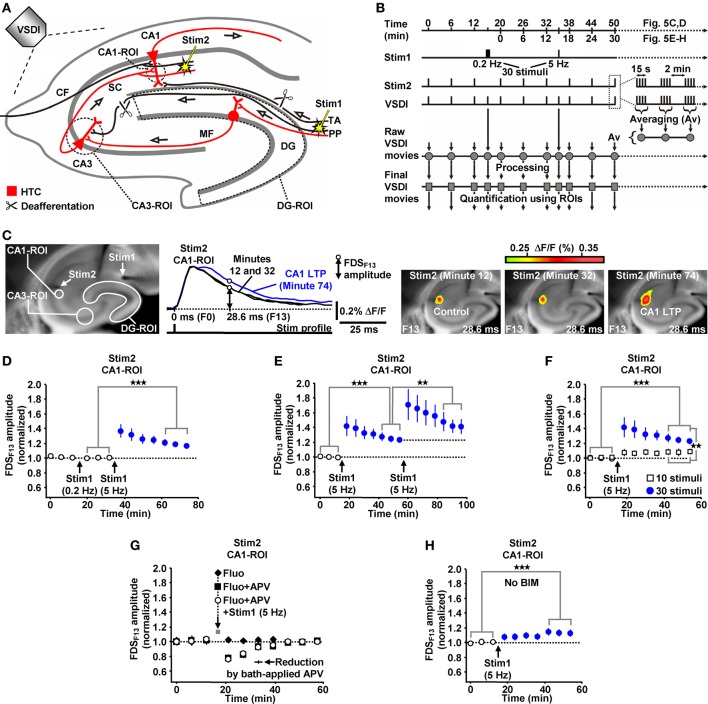
Figure 5.
HTC-Waves evoke NMDA receptor-dependent CA1 LTP. (A,B) Experimental arrangement and protocol used for the investigations shown in (C–H) (“CF” in A stands for “commissural fiber”). (C) Illustration and outcome of one of the experiments summarized in (D). (D) 5 Hz EC/DG-input for 6 s elicited CA1 LTP, which was not saturated as shown in (E) (D, N = 13 slices/8 mice; E, N = 8 slices/5 mice). (F) 5 Hz EC/DG-input for 2 s failed to evoke statistically significant CA1 LTP [open squares; N = 7 slices/5 mice; p > 0.05 (paired t-test)]. Blue circles represent data shown in (E). (G) A blockade of NMDA receptors at CA3-CA1 synapses by a Fluo (10 μM)-guided administration of APV (200 μM; 1 min) specifically to area CA1 prevented the formation of CA1 LTP [N = 6 slices/4 mice; N = 5 slices/4 mice for control experiments with Fluo; N = 6 slices/4 mice for control experiments with Fluo + APV; and N = 5 slices/3 mice for control experiments with APV (50 μM) bath-applied to slices (for rationale see “Materials and Methods”)]. (H) 5 Hz EC/DG-input evoked CA1 LTP also in the absence of BIM (N = 10 slices/6 mice). (D–F,H) **p < 0.01 (paired or unpaired t-test); ***p < 0.001 (paired t-test).

