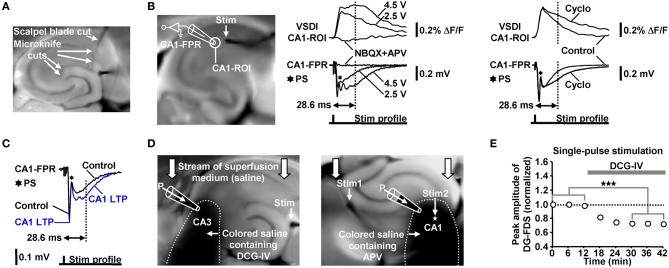
Figure 7.
(A) Illustration of the deafferentations performed in hippocampal slices. (B) Characterization of the FDSF13 amplitude by simultaneously recorded CA1-FDSs and CA1 (stratum radiatum) fEPSPs. Cyclothiazide (Cyclo), NBQX, and APV were bath-applied at concentrations of 100, 5, and 50 μM, respectively. (C) 5 Hz EC/DG-input for 6 s caused a long-lasting increase in the slope and the amplitude of CA1 (stratum radiatum) fEPSPs 28.6 ms after the stimulation pulse. The field potential depicting the CA1 LTP was recorded 40 min after the 5 Hz EC/DG-input. (D) Illustration of the Fluo-guided administration of DCG-IV and APV to areas CA3 and CA1, respectively. For a better image presentation of the spread of the pressure-ejected saline, Ponceau S was added instead of Fluo to the pipette solution. (E) Bath application of 1 μM DCG-IV to slices reduced neuronal activity in the DG (N = 6 slices/3 mice). ***p < 0.001 (paired t-test). (B,C) Stimulus artifacts in FPR traces were truncated for clarity.

