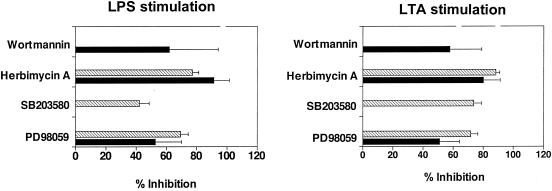
FIG. 5.
Effects of signal transduction inhibitors on TR6 and TNF-α release from LPS- or LTA-stimulated MDC. The cells were incubated with LPS or LTA (from B. subtilis) in the absence or presence of 50 μM PD98059 (p42/p44 MAPK inhibitor), 1.25 μM SB203580 (p38 MAPK inhibitor), 1.25 μM herbimycin A (tyrosine kinase inhibitor), or 0.05 μM wortmannin (PI3K inhibitor). The release of TR6 (black bars) and TNF-α (hatched bars) in the culture supernatants was analyzed by ELISA. Data shown represent mean values ± standard deviations for independent experiments conducted with cells of three donors.

