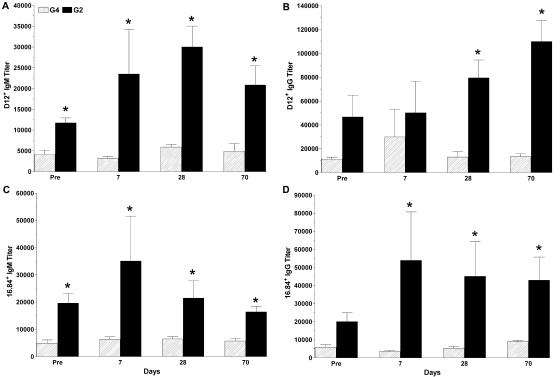
FIG. 4.
Titers of antibodies expressing the VH3 determinants recognized by mouse MAbs D12 and 16.84 in P13-DT-vaccinated G2 and G4 mice. The y axis shows the inverse titer of antibodies for the times after primary vaccination shown on the x axis for G4 and G2 mice. Error bars represent the standard error of the mean. An asterisk indicates a P value of <0.05 for a comparison of titers in G2 and G4 mice, as determined by the Mann-Whitney U test. There were five mice per group. Pre, preimmunization.

