
FIG. 6.
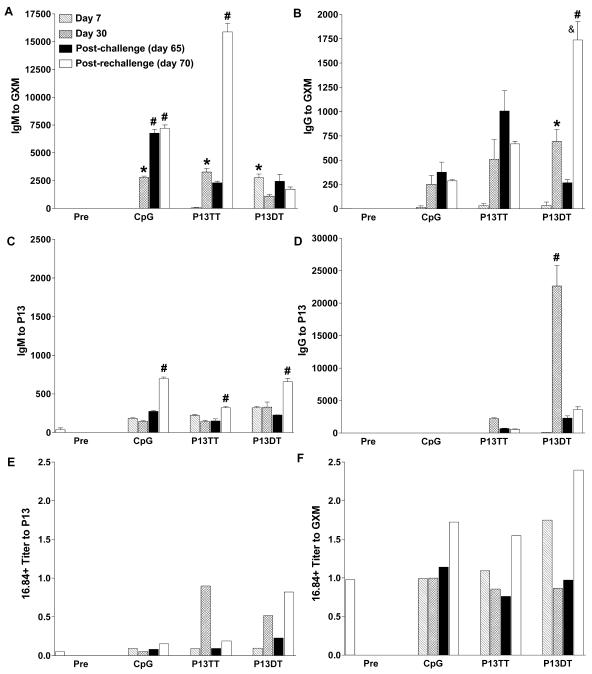
Serum antibody profiles of P13-DT-, P13-TT-, and CpG-vaccinated G2 mice in the C. neoformans challenge experiment depicted in Fig. 5. Days 7 and 30 represent days after primary vaccination, and days 65 and 70 represent days after C. neoformans challenge. The y axis shows the inverse titer for the immunogens shown on the x axis at the designated times. GXM was from strain 24067. Error bars represent the standard error of the mean. An asterisk indicates a P value of ≤0.01 for a comparison of preimmunization (Pre) sera and sera obtained at days 7 and/or 30 after primary vaccination. A number sign indicates a P value of ≤0.01 for a comparison of day 30 after primary vaccination and days 65 and/or 70 after C. neoformans challenge. An ampersand indicates a P value of ≤0.01 for a comparison of day 65 after C. neoformans challenge and day 70 after the first C. neoformans challenge (day 5 after rechallenge). Comparisons were made by a one-way ANOVA with the Bonferroni posttest.