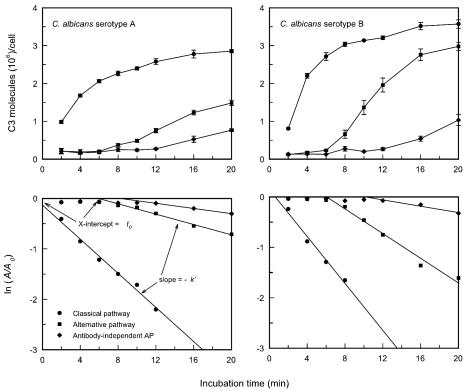
FIG. 4.
Kinetics for binding of C3 to cells of C. albicans serotype A or serotype B following incubation in PHS in which (i) the classical pathway was intact, (ii) the classical pathway had been blocked by treatment with Mg-EGTA, or (iii) both the classical pathway had been disabled by treatment with Mg-EGTA and antibody-dependent activation of the alternative pathway had been blocked by absorption of sera to remove mannan antibody (antibody-independent alternative pathway [AP]). Data are reported as the mean number ± standard error of the mean (SEM) of C3 molecules bound per cell at each incubation time in four independent experiments (upper panels) or as the results of a pseudo first-order kinetic analysis of the consumption of sites available for C3 binding where A0 is the maximum number of sites available for C3 binding and A is the number of unoccupied sites at each time interval (see Materials and Methods) (lower panels). The slope of the pseudo first-order plot yields −k′, the pseudo first-order rate constant, whereas the intercept of the plot with the x axis yields t0, in minutes, or the lag time before rapid accumulation of C3 occurs.

