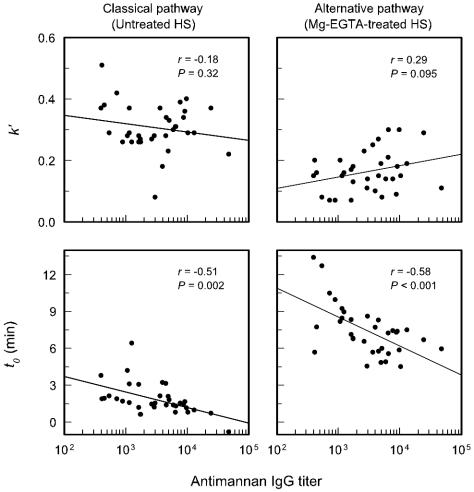
FIG. 6.
Correlation between the antimannan IgG titer (determined by ELISA with serotype B mannan in the solid phase) and the kinetics for C3 accumulation on serotype B strain 36803. The reported antimannan titers reflect the use of 40% serum concentrations in the assay. Each point is the result for 1 of 34 sera from normal adult donors. C3 accumulation via the classical pathway was assessed with untreated sera; sera were treated with Mg-EGTA to assess alternative pathway activity. The kinetics for deposition of C3 from each serum sample are expressed as k′, the pseudo first-order rate constant, and as t0, the intercept of the first-order rate plot with the x axis (as described in the legend to Fig. 4). HS, human sera.

