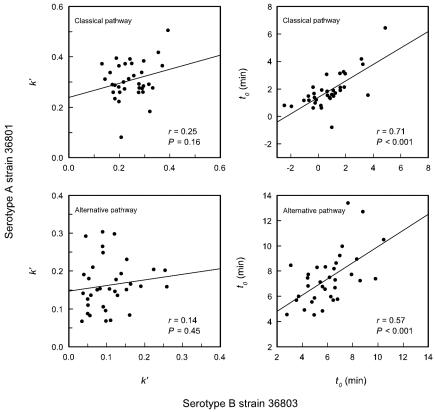
FIG. 7.
Correlation between the kinetics for deposition of C3 from individual sera onto C. albicans cells of serotype A (strain 36801) and serotype B (strain 36803). Each data point represents results from a different serum donor. Parameters measured were k′ (left panels) and t0 (right panels) for deposition of C3 from sera in which the classical pathway was intact (upper panels) or sera that had been treated with Mg-EGTA to block the classical pathway (lower panels).

