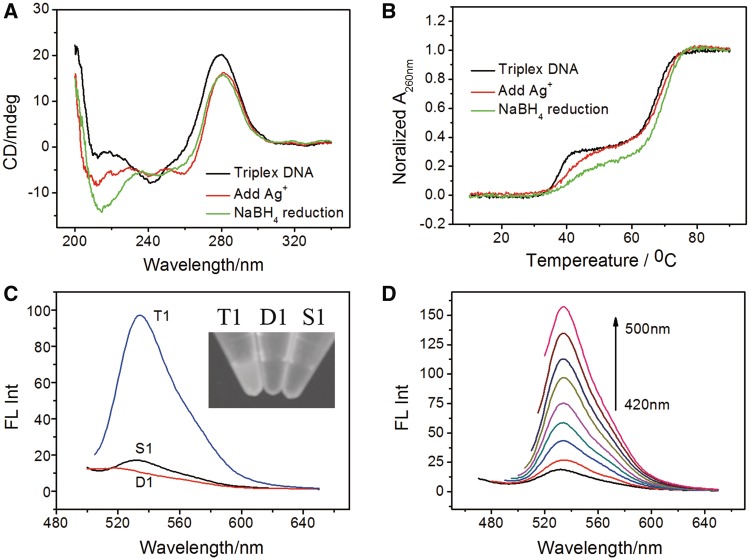
Figure 1.
(A) CD spectra of (a) T1, (b) T1-Ag(I) ions and (c) T1-AgNCs. (B) UV melting analysis of T1, T1-Ag(I) ion and T1-AgNCs. (C) Fluorescence emission spectra acquired for T1, D1, S1 solutions, upon excitation at 480 nm. Inset: Fluorescence images of T1, D1, S1-templated AgNCs samples (from left to right). (D) Fluorescence emission spectra of T1-AgNCs with excitation wavelength from 420 nm to 500 nm. [DNA] = 2 µM, [AgNO3] = 12 µM, [NaBH4] = 48 µM.

