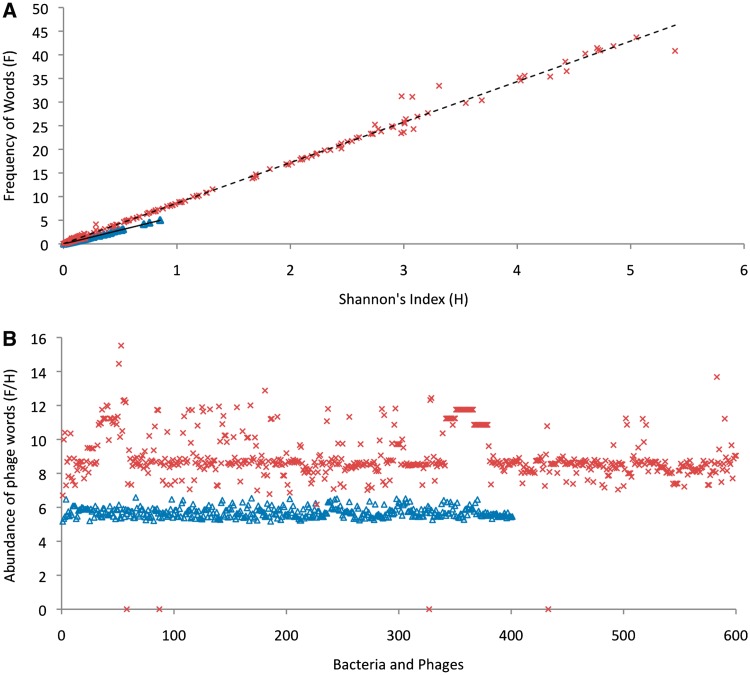
Figure 6.
Comparison of the abundance of phage words in bacteria (triangles) and phage genomes (x). (A) The Shannon’s index (H) versus the frequency (F) of the presence of phage words for 600 complete phage genomes and 400 randomly chosen complete bacterial genomes. Both H and F are very small for bacterial genomes compared to phage genomes. The relationship between H and F for phages is F = 8.57 H + 0.047 with a regression coefficient R2 = 0.995 and for bacterial genome the relation is F = 5.85 H + 0.014 with a regression coefficient R2 = 0.993. (B) The ratio of the frequency and Shannon’s index, i.e. F/H for 600 complete phage genomes and 400 randomly chosen complete bacterial genomes. There is a statistically significant difference in F/H (abundance of phage words) between phages and bacteria.

