
Figure 3.
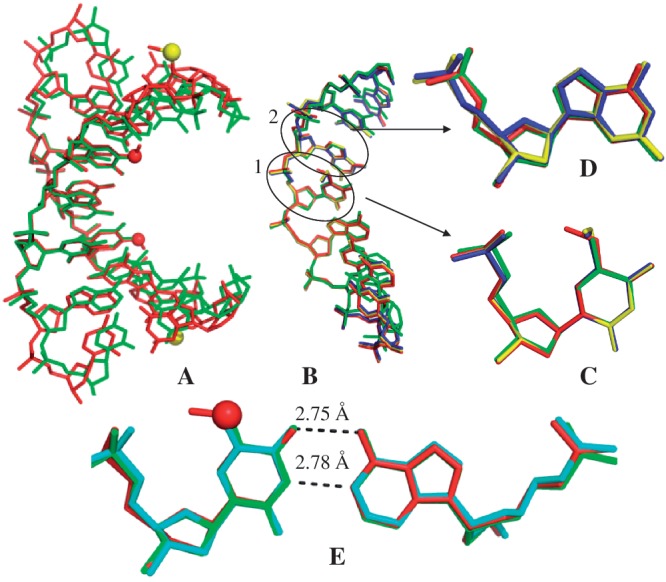
Crystal structure comparisons. The red and yellow balls represent the oxygen and selenium atoms of the modified moieties, respectively. (A) The superimposed duplex structures of 5′-G(SedU)G(mo5dU)ACAC-3′ (3a; in red; PDB ID: 3LTR; 1.30 Å resolution) and the corresponding native (in green; PDB ID: 1DNS; 2.0 Å resolution). (B) The superimposed single-strand structures of 3a (5-OMe-DNA; in red), 3b (5-SMe-DNA; in blue; PDB ID: 3IKI; 1.38 Å resolution), 3c (5-SeMe-DNA; in yellow; PDB ID: 3LTU; 1.40 Å resolution) and the corresponding native (in green; PDB ID: 1DNS). This high-resolution structure of 5-SeMe-DNA (3c), indicating no H-bond formation between the 5-SeMe and 5′-phosphate groups, updates the lower-resolution structure (PDB ID: 3BM0). (C) Superimposed modified dU4 and T4 residues in these four DNAs. (D) Superimposed local structures of dG3 in these four DNAs. (C and D are in the same color code as B). (E) The superimposed structures of mo5dU4/dA base pair of 3a (3LTR; in red), T4/dA of the native (1DNS; in green], and the native T4/dA base pair of 5′-G(SedU)GTACAC-3′ (1Z7I; in cyan; 1.28 Å resolution). The native T4 of 5′-G(SedU)GTACAC-3′ (PDB ID: 1Z7I; 1.28 Å resolution) is displayed, since the resolution of the native structure (1DNS; 2.0 Å resolution) is low and the highly ordered water molecules at T4 are not demonstrated. These two structures (1Z7I and 1DNS) are virtually identical.