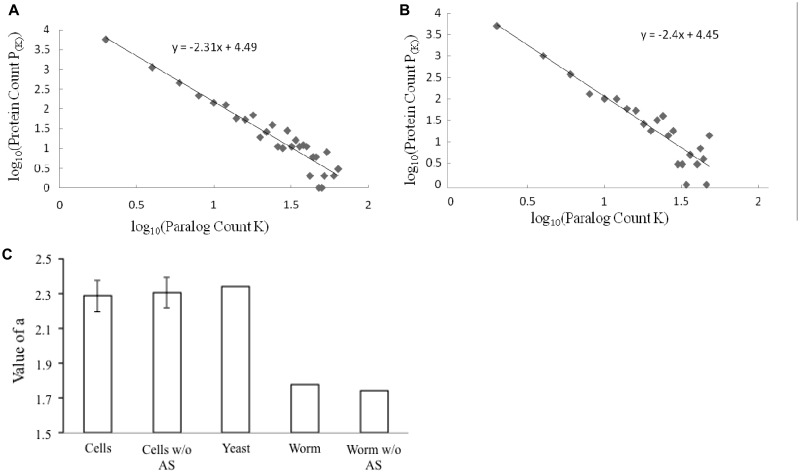
Figure 2.
The proteomes of individual cell types display paralog abundance comparable to that of the yeast S. cerevisiae, as measured by the value of α. (A and B). The log–log plot of paralog count distributions in the proteomes of C. elegans cilia and gut, respectively, is shown. The lines and equations of the linear regressions are also shown in the graphs. (C) Comparison of the value of α of S. cerevisiae proteome and the average of those of the proteomes of specific C. elegans cell types. The bars are labeled as follows: ‘Cells’ denotes average α-values of the 12 C. elegans cell types; ‘Worm’ denotes α-value of C. elegans whole proteome; ‘w/o AS’ denotes α-values were calculated without consideration of alternative splicing; and ‘Yeast’ denotes α-value of S. cerevisiae proteome. The standard deviation of the α-values of the 12 C. elegans cell types was used as error bar.

