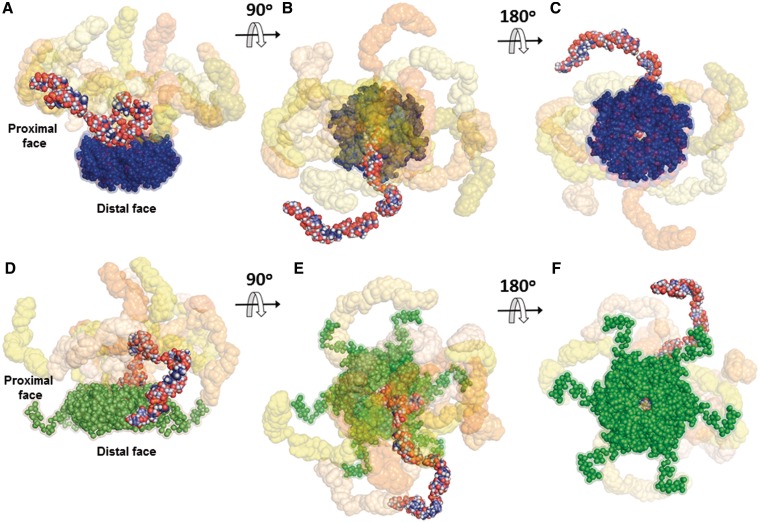
Figure 5.
Rigid body models of HfqEc65–DsrA34 and HfqEc–DsrA34 complexes. (A–C) Ten typical models for the HfqEc65–DsrA34 complex are superimposed and shown at three different plane rotations. HfqEc65 atomic coordinates were derived from the crystal structure pdb1HK9 (7) (solvent accessible surface representation in blue). The models were generated using SASREF (46) and SAXS data combined with constraints obtained from NMR. (D–F) Ten typical models of the HfqEc–DsrA34 complex are superimposed and shown at three different plane rotations. The HfqEc structure (solvent accessible surface representation in green) was derived from the high-resolution crystal structure pdb1HK9 (7) with the C-terminal segment modelled using SAXS data (29). In both complexes, one DsrA34 molecule is represented as full-atom model with atoms colour-coded to highlight the overall structure of the RNA in the complex, while the other nine models are presented with their solvent accessible surface (in different tonalities ranging from light yellow to deep orange). In both cases, the best DsrA34 models that fit the SAXS data display an extended conformation. The average root mean square deviation between the DsrA34 portions in the models, (60 ± 20 Å), is similar to that between the selected models in the EOM ensembles.

