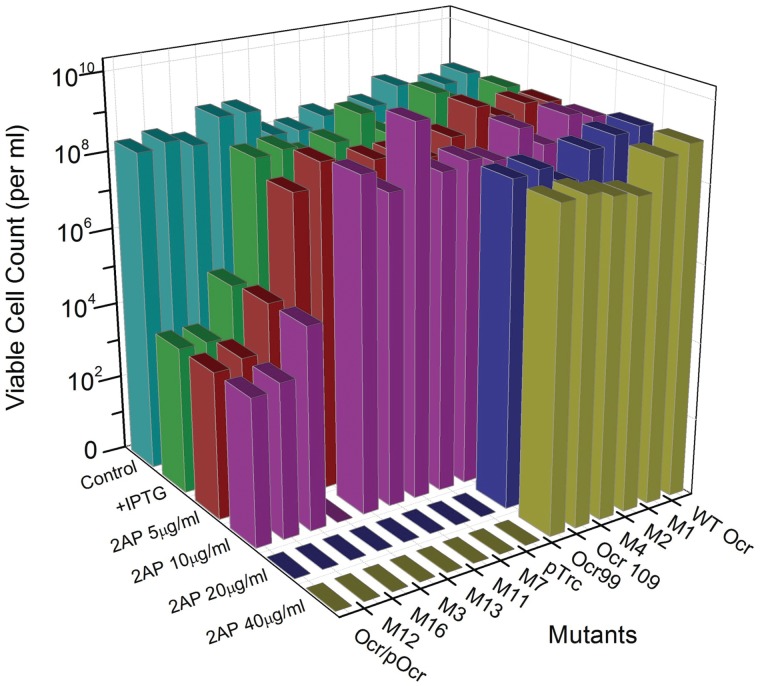
Figure 2.
The RA assay measuring cell survival of E. coli NM1041 (clpX−, r+m+) when transformed with various plasmids expressing Ocr or its mutant forms. The graph shows growth on LB-agar plates supplemented with antibiotics (cyan) only, antibiotics and ITPG (green) and, in the presence of antibiotics, IPTG plus increasing concentrations of 2AP (5, 10, 20 and 40 µg/ml are red, magenta, blue and olive, respectively).

