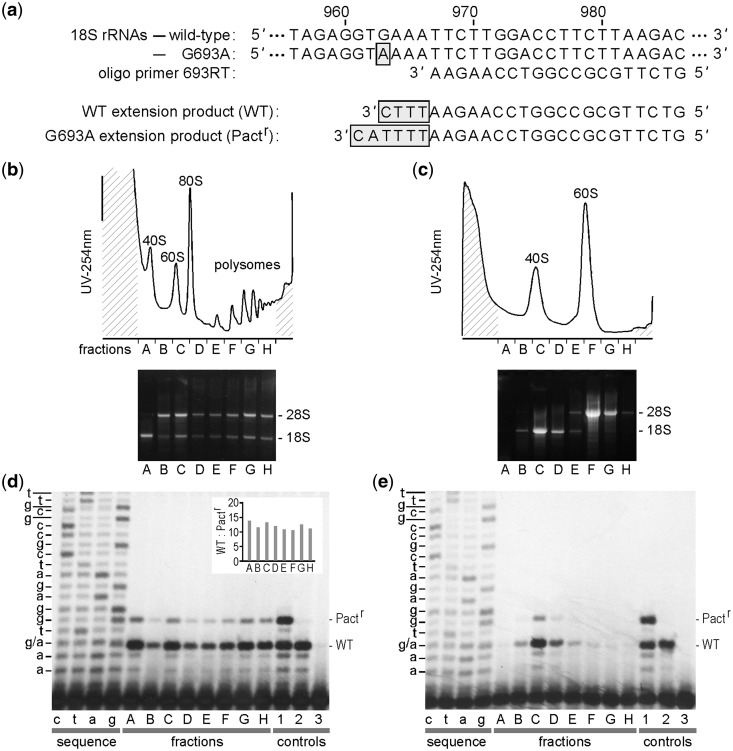
Figure 5.
Sucrose density gradient distributions of ribosomal subunits containing synthetic 18 S rRNAs. (a) ddCTP primer extension assay. Partial sequences of WT and mutated 18 S rRNAs are shown. The position of the pactamycin-resistance mutation (G693A), located at nucleotide 963 in 18 S rRNA, is highlighted. The sequence of oligonucleotide primer 693RT is shown aligned to its complementary match in the 18 S rRNAs. Primer extension reactions performed in the presence of ddCTP will terminate at the first G located upstream of the primer. This will result in 4-nt-extended products from WT 18 S rRNA templates and 6-nt-extended products from G693A-mutated 18 S rRNAs. In each case, the extended nucleotides are highlighted. (b) Top: Lysates from cycloheximide-treated N2a cells transfected with p18 S.1(G693A) were fractionated in a 10–50% (w/v) linear sucrose gradient. Peaks (left to right) represent 40S ribosomal subunits, 60S ribosomal subunits, 80S single ribosomes, and polysomes. The fractions (A-H) that were collected for RNA analysis are indicated. Bottom: RNA prepared from fractions A-H was visualized in an ethidium bromide-stained agarose gel. The 28S and 18 S rRNAs are indicated. (c) Top: EDTA-dissociated ribosomes were fractionated on a 10–35% (w/v) linear sucrose gradient. Peaks (left to right) represent 40S and 60S ribosomal subunits. Bottom: RNA analysis as in panel (b). (d) PAGE analysis of RNA prepared from fractions of the sucrose gradient in panel (b), which were subjected to ddCTP primer extension using oligonucleotide primer 693RT, which was 33-P-labeled. The sequencing reactions (lanes c,t,a,g) used the same primer with total RNA as a template. The upper bands are generated from the synthetic 18 S rRNA (Pactr) and the lower bands are from endogenous 18 S rRNA (WT). Lanes 1-3 are controls. Control 1 is an equimolar mixture of in vitro transcripts that contain or lack the pactamycin resistance mutation. Control 2 is total RNA from untransfected N2a cells, which contains only the WT 18 S rRNA. Control 3 is a no template control. The levels of the primer extension products from the various fractions were quantified from Phosphorimager exposures and the ratios of the two bands (WT:Pactr) are shown in the inset. (e) ddCTP primer extension from fractions of gradient in panel (c).

