Figure 3.
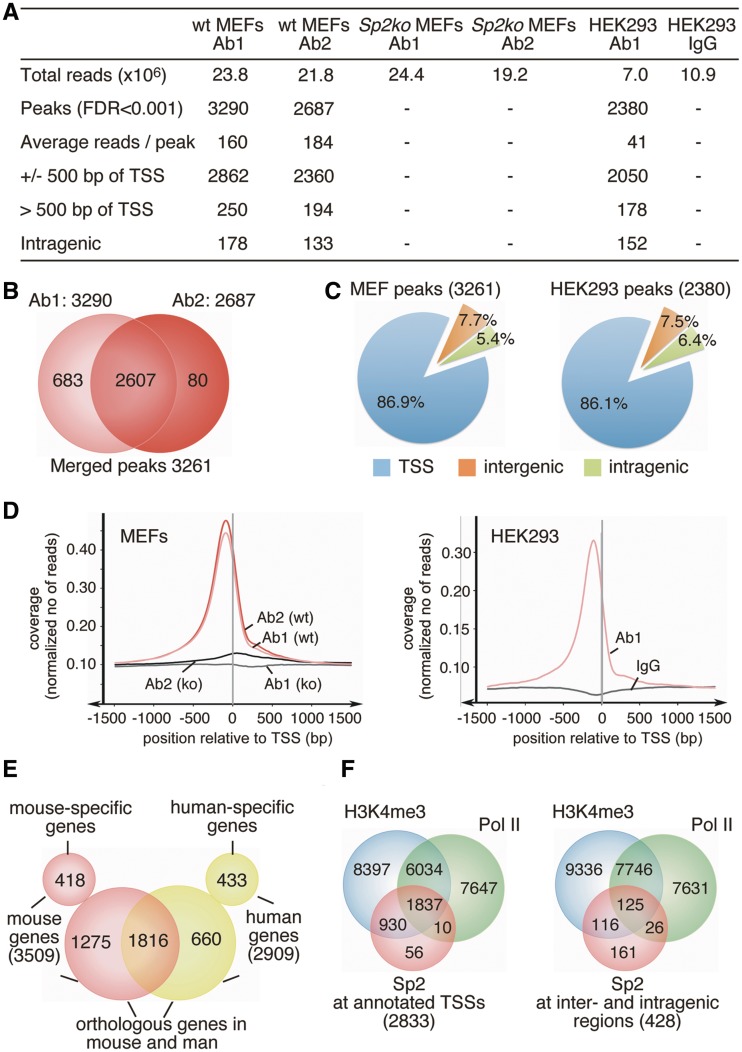
Overview of ChIP-Seq results. (A) Summary of Sp2 ChIP-Seq analysis. (B) Venn diagram showing the overlap of Sp2 peaks obtained with two different Sp2 antibodies (Ab1 and Ab2). The total of 3261 high-confident sites were obtained by merging Sp2-binding sites that had at least an FDR < 0.001 with one antibody and an FDR < 1 with the other antibody. (C) Distribution of Sp2 occupancy in MEFs and HEK293 cells relative to annotated genes. (D) Averaged Sp2 coverage around TSSs in MEFs and HEK293 cells normalized to 1 million reads. (E) Venn diagram showing the overlap of genes with Sp2-binding sites in MEFs and HEK293 cells. (F) Venn diagrams showing the overlap of Sp2-binding sites with the presence of H3K4me3 signatures (37,38) and promoter-proximal paused RNA polymerase II (36) in MEFs. Left diagram, overlap at annotated TSSs; right diagram, overlap at inter- and intragenic sites.

