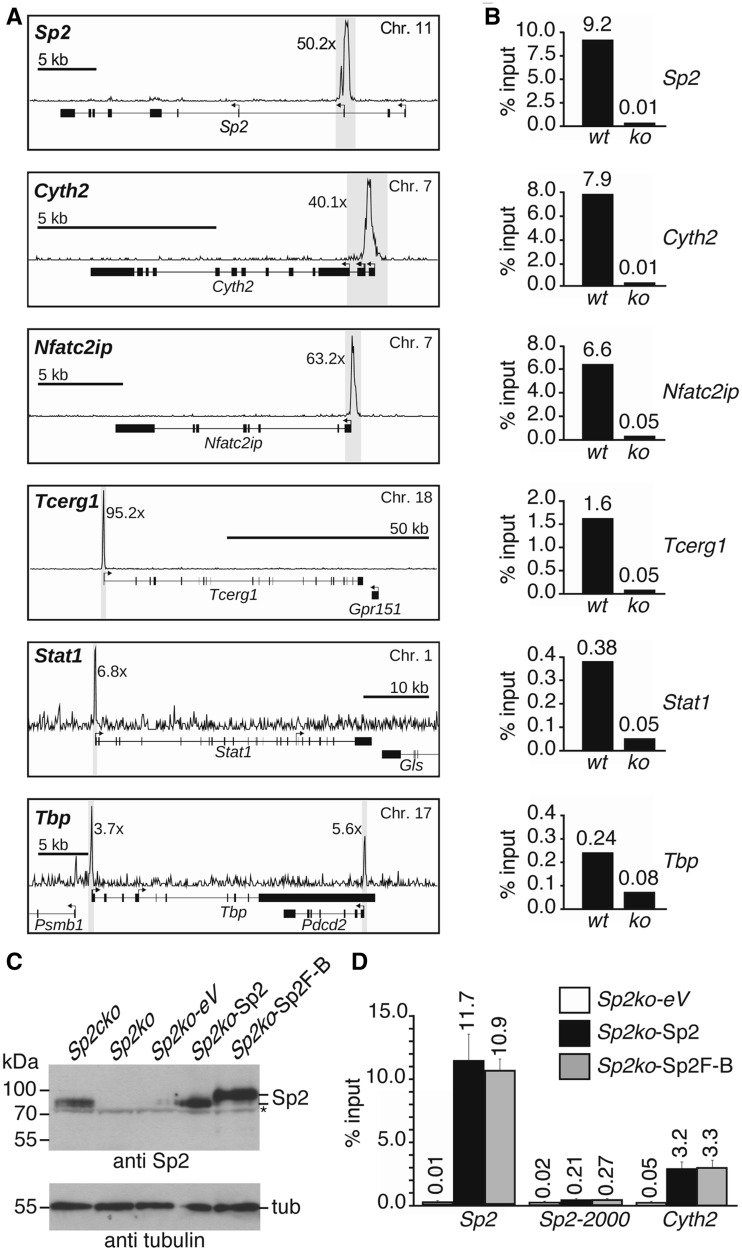
Figure 4.
Validation of representative Sp2 targets identified by ChIP-Seq analysis of MEFs. (A) Snapshot signal maps of representative Sp2 target genes (Sp2, Cyth2, Nfat2cip, Tcerg1, Stat1 and Tbp) along with their exon–intron structure and TSSs indicated by arrows. The numbers next to the peaks indicate the enrichment in wt MEFs relative to Sp2ko MEFs. (B) ChIP–qPCR analysis of Sp2 occupancy in wt and Sp2ko MEFs (ko) at high (Sp2, Cyth2, Nfat2cip and Tcerg1) and low (Stat1 and Tbp) ChIP-Seq hits. (C) Western blot analysis of Sp2 in Sp2cko and Sp2ko MEFs transduced with an empty control (Sp2ko-eV) or Sp2-expressing retroviruses (Sp2ko-Sp2, untagged Sp2 and Sp2ko-Sp2F-B, C-terminal Flag-Biotin-tagged Sp2). The asterisk marks a cross-reacting protein. To control for loading, the same blot was re-probed for tubulin. (D) ChIP–qPCR analysis of Sp2 occupancy at the Sp2 gene (Sp2, promoter region; Sp2-2000, 2000-bp upstream of the TSS) and at the Cyth2 gene in rescued MEFs. The percent of input values are mean ± SD (n = 3). A list of gene abbreviations is found in Supplementary Table S3.

