Figure 6.
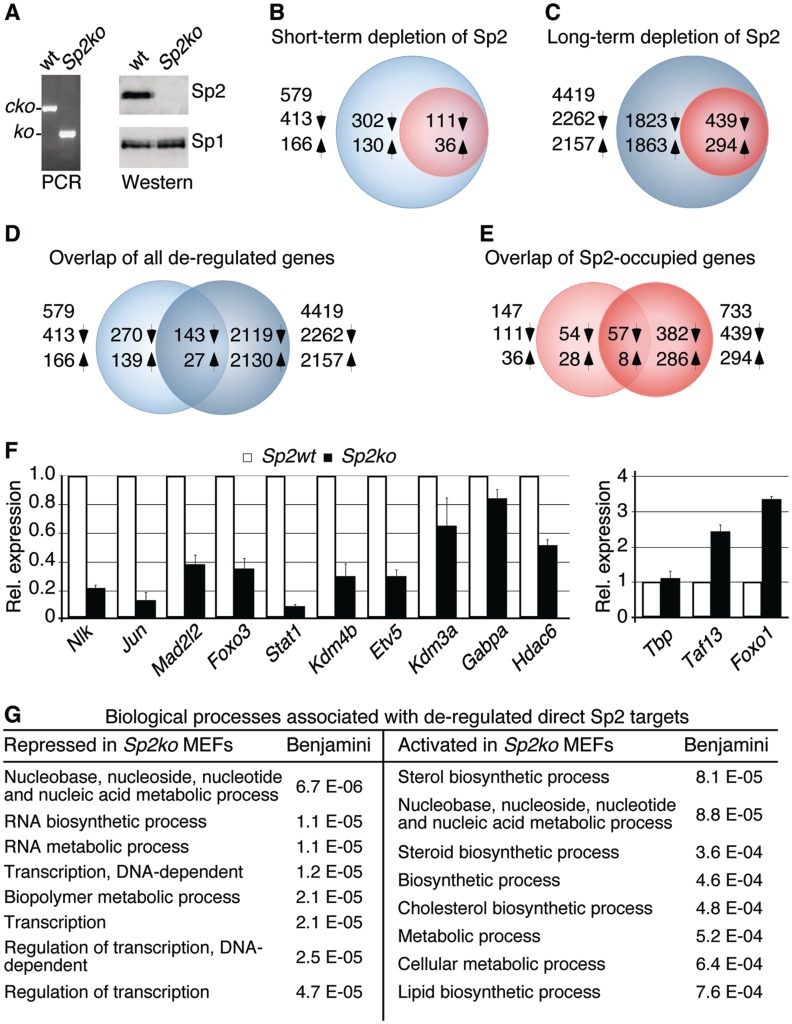
Gene-expression profiling of Sp2 target genes in MEFs. (A) PCR and western blot analyses of Sp2cko MEFs transduced with an empty retrovirus (wt) or a Cre-expressing vector (Sp2ko) after several weeks in culture. The western blot was re-probed for Sp1. (B, C) Venn diagrams showing de-regulated genes after short-term (B) and long-term depletion (C) of Sp2. Blue circles denote indirect and red circles direct Sp2 target genes. (D, E) Overlaps of all genes (D) and direct Sp2 target genes (E) that were de-regulated after short-term and long-term depletion of Sp2. Up arrows indicate activated and down arrows repressed genes. (F) Quantitative RT–PCR analysis of ten randomly chosen repressed and three activated direct Sp2 target genes. Normalized mRNA levels are presented relative to Sp2cko MEFs infected with an empty vector (Sp2wt) arbitrarily set to 1. Data are expressed as mean ± SD (n = 3). (G) Classification of direct Sp2 target that was repressed and activated in Sp2ko MEFs. Shown are the eight top-scoring hits of the GO analysis along with their Benjamini values.

