Figure 7.
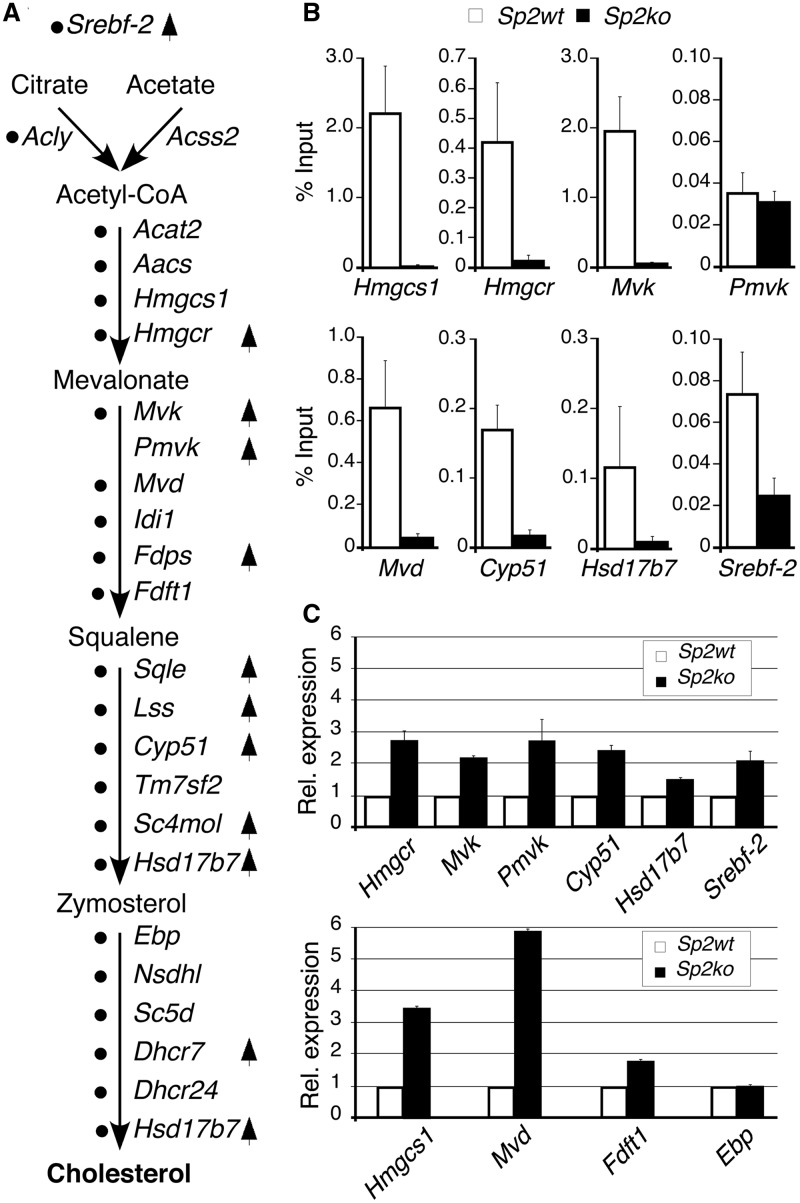
Sp2 negatively regulates cholesterol biosynthesis. (A) The cholesterol biosynthesis pathway with key intermediates and enzymes indicated by their gene symbols. Black dots mark genes that were occupied by Sp2 at their promoters in MEFs. Arrows indicate genes that were activated in Sp2ko MEFs revealed by microarray-based expression profiling. (B) ChIP–qPCR analysis of Sp2 occupancy at selected target promoters in MEFs. (C) qRT–PCR analysis of ten randomly chosen cholesterol biosynthesis pathway genes including four genes (Hmgcs1, Mvd, Fdft1 and Ebp) that were not found by the microarray-based expression profiling. Normalized mRNA levels in Sp2ko MEFs are presented relative to Sp2wt MEFs arbitrarily set to 1. Data are expressed as mean ± SD (n = 3).

