Figure 2.
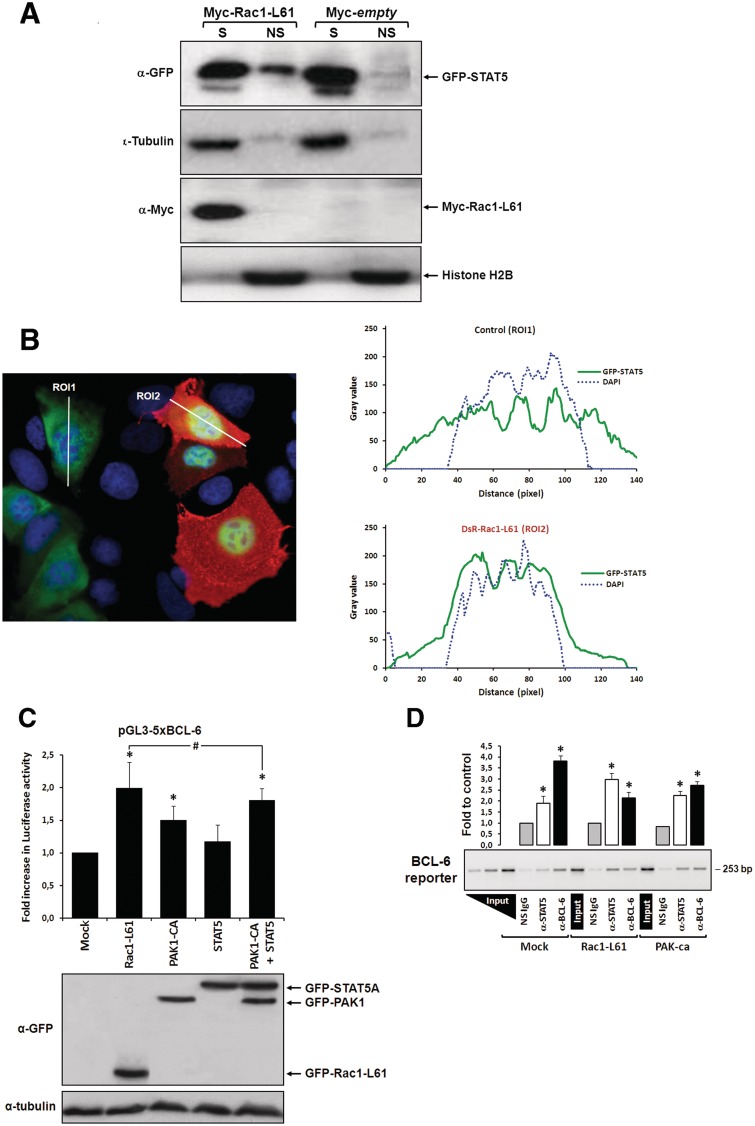
Rac1 signalling switches promoter occupancy from BCL-6 to STAT5. (A) DLD-1 cells were transfected with Myc-Rac1-Q61L or control empty vector and 24 h later analyzed by Western blot for the subcellular distribution of STAT5 between a soluble (S) and a chromatin-bound non-soluble (NS) fraction (detection of α-tubulin and histone 2B served as controls). Note that active Rac1 promotes retention of STAT5 in the non-soluble chromatin fraction. (B) Subcellular localization of STAT5 determined by confocal fluorescence microscopy in DLD-1 cells co-transfected with DsRed-Rac1-Q61L and GFP-STAT5A. The overlay image of the DAPI, GFP and DsRed channels is shown. A microscopic field was chosen that contained side by side untransfected cells (blue nuclei), cells that transfected only with GFP-STAT5 (green cells) and cells that co-transfected with both GFP-STAT5 and DsRed-Rac1-Q61L (red cells). Note the nuclear STAT5 signal in Rac1-expressing red cells. In addition, two plots are given showing the DAPI and GFP signal intensities measured along the indicated regions of interest (ROI, white lines). The signal intensity of GFP did not increase across the nuclear DAPI region when cells expressed only GFP-STAT5 (green cells, ROI 1), whereas nuclear GFP signal clearly increased when cells co-expressed active Rac1 (red cells, ROI 2), confirming nuclear translocation of GFP-STAT5. (C) DLD-1 cells were co-transfected with the reporter and the indicated expression vectors, as described for Figure 1B. Note that STAT5 activates the BCL-6 luciferase reporter and, when combined with PAK1, reaches the stimulation levels normally induced by active Rac1, *P < 0.05 and #P > 0.05. (D) Chromatin immunoprecipitation (ChIP) of the reporter vector with anti-(α)-BCL-6, α-STAT5 or a non-specific antibody (NS immunoglobulin G) from lysates of DLD-1 cells transfected with the indicated expression vectors. A representative semi-qPCR of the precipitated promoter fragment quantities with a graphical representation of the respective band intensities quantified by densitometry from digital images obtained in 3 independent transfection experiments, *P < 0.05, is shown. Two serial dilutions of input DNA were co-amplified to guarantee semi-qPCR conditions and allow product quantity extrapolation from band intensities.

