FIG. 3.
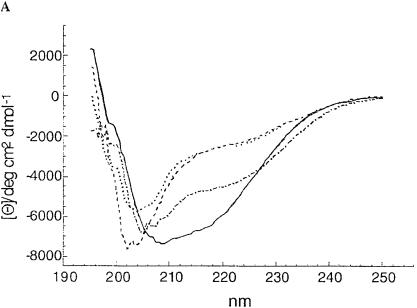
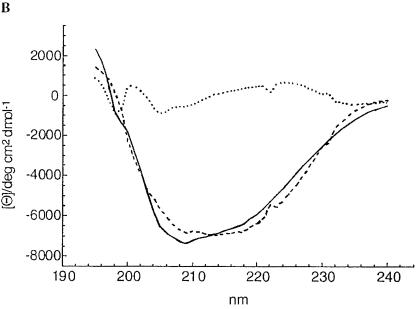
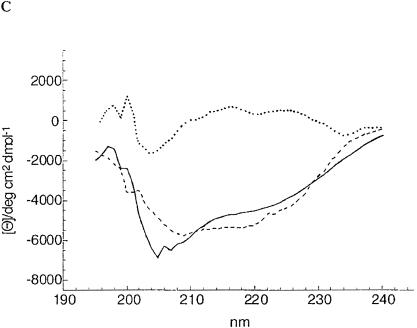
(A) CD spectra of secreted, active ShlA242-His6 (—), cytosolic C-ShlA242*-His6 (- - -), periplasmic ShlA242*-His6 ( · - · - · -), and inactive secreted ShlA242*-His6 ( · · · · · ). (B) Estimated CD spectrum of secreted, active ShlA242-His6 (—), calculated CD spectrum (- - -), and the difference between the two spectra ( · · · · · ). (C) estimated CD spectrum of periplasmic, inactive ShlA242*-His6 (—), calculated CD spectrum (- - -), and the difference between the two spectra ( · · · · · ).


