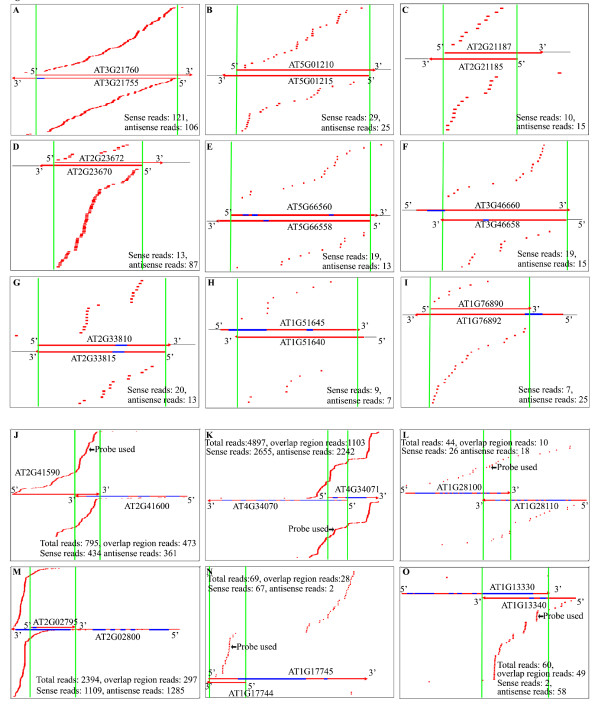
Figure 1.
Distinct distribution patterns of Arabidopsis nat-siRNAs. (a-i) Arabidopsis nat-siRNAs displaying a distributed pattern and exclusively derived from the overlapping regions. (j-o) Arabidopsis nat-siRNAs displaying a distributed pattern but derived from both the overlap region and non-overlap region. sRNAs matching the upper and lower strands are displayed above and below the NAT pairs, respectively. The red regions on the gene model represent exons, whereas the blue regions represent introns. The region between the green lines represents the overlapping region of the NATs. siRNAs probed are indicated by black arrows.

