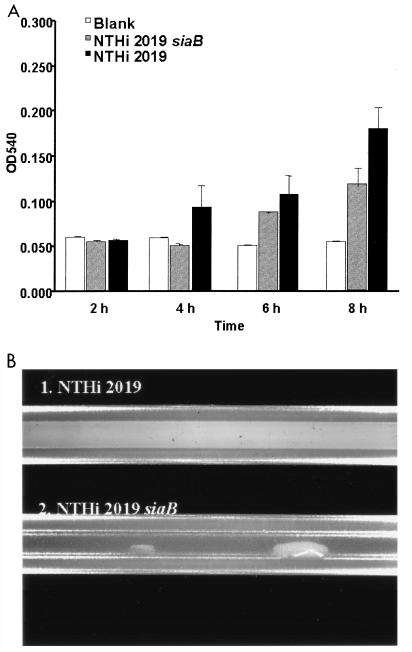
FIG. 3.
(A) Comparison of levels of biofilm formation by NTHi 2019 and an isogenic siaB mutant. Bacteria were seeded into microtiter dishes, and biofilm formation was assessed at the times indicated by crystal violet staining (see Fig. 1A and Materials and Methods). OD540, optical density at 540 nm. (B) Comparison of levels of biofilm formation by NTHi 2019 and an isogenic siaB mutant in a continuous-flow silicon tube model system. A continuous flow of supplemented BHI medium was maintained, and the tubes were photographed 48 h postinoculation.

