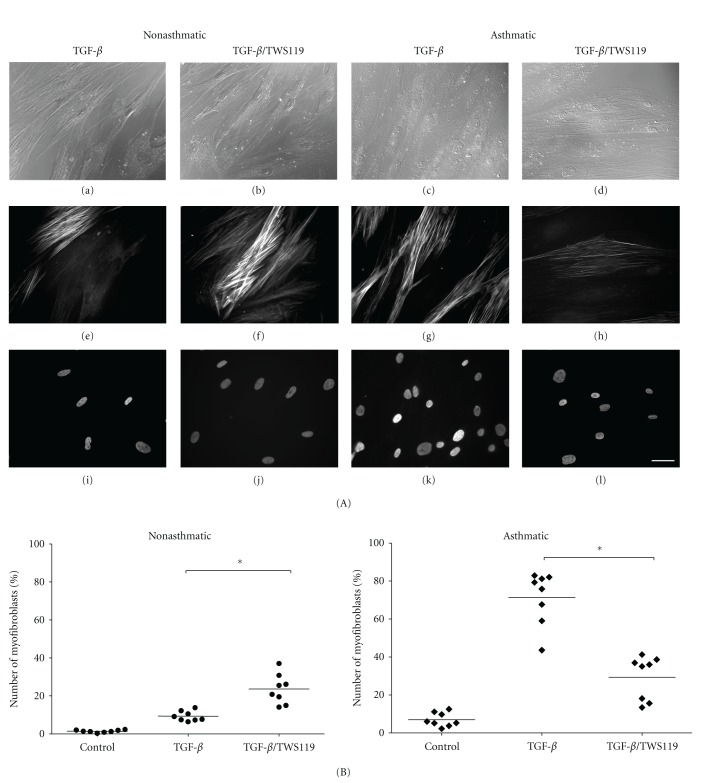
Figure 3.
The effect of inhibition of GSK-3β on TGF-β 1-stimulated FMT in nonasthmatic and asthmatic HBFs. HBFs from non-asthmatics (n = 8) and asthmatics (n = 8) were cultured in DMEM supplemented with 0.1% BSA and TGF-β 1 (5 ng/mL), TWS119 (10 μM), or TGF-β 1/TWS119 (A, B). (A) Representative images of HBF from NA and AS culture: Nomarski interference contrast microscopic images (a–d), immunofluorescent staining of α-SMA (e–h), and Hoechst staining of cell nuclei (i–l). Bar = 50 μm. (B) Graphs showing the percentage of myofibroblasts after 7-day culture of HBFs. Each point represents a single HBF culture from NA and AS groups (the means of at least three separate experiments for each culture are presented, in the one experimental point, at least 100 cells were counted). Bars on graphs represent mean values. The significance of differences between TGF-β 1-stimulated HBFs without TWS119 and with the inhibitor was determined by applying Kruskal-Wallis non-parametric ANOVA, *P < 0.05.

