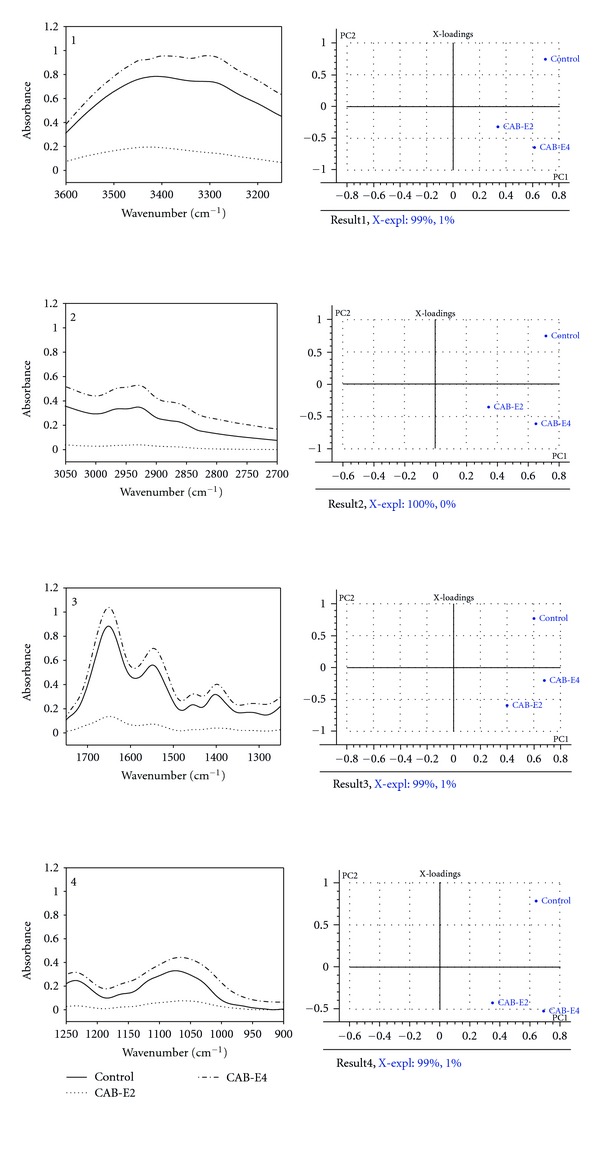
Figure 12.

FT-IR spectra and principal component analysis of MSSA-A8 treated with CAB-E2 and E4. (1) 3500–3100 cm−1: hydration of bacterial cells; The explained variation in X by PC1 and PC2 was 99 and 1%, respectively. (2) 3050–2700 cm−1: fatty acids in the bacterial cell membrane; The explained variation in X by PC1 and PC2 was 100 and 0%, respectively. (3) 1700–1600 cm−1: amide linkage from proteins and peptides; The explained variation in X by PC1 and PC2 was 99 and 1%, respectively. (4) 1500–1000 cm−1: mixed region, proteins, and fatty acids; The explained variation in X by PC1 and PC2 was 99 and 1%, respectively.
