
Figure 6.
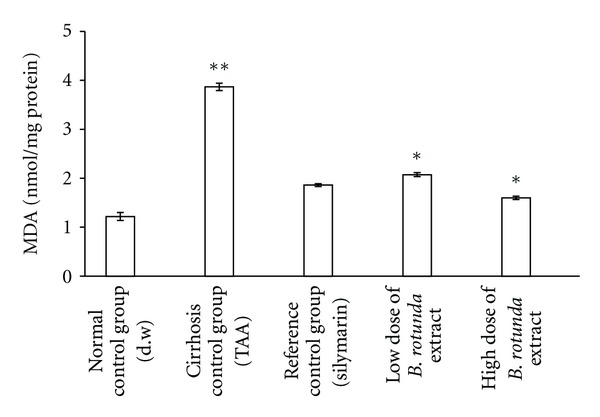
Effect of the BR extract on the level of MDA in the liver tissue. Data were expressed as Mean ± SEM. Means between the silymarin treated Group 3, low-dose BR-treated Group 4, and high-dose BR-treated Group 5 had significant differences when compared with the cirrhosis control Group 2 with *P < 0.001 and compared with the normal control Group 1 with **P < 0.001.