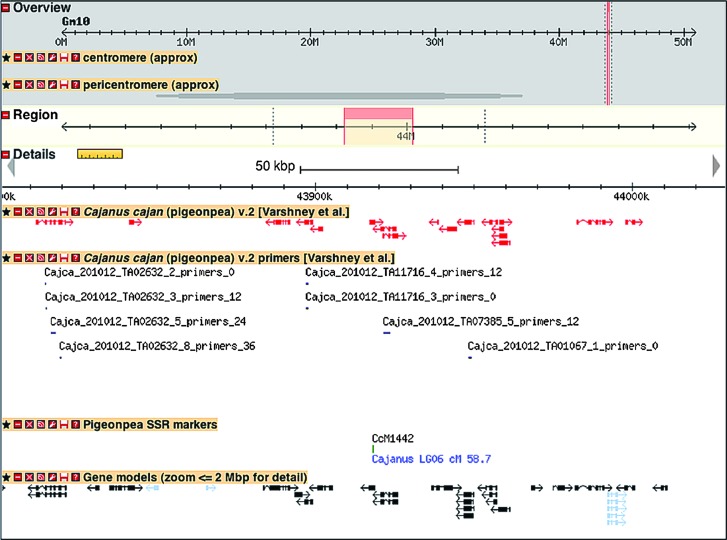
Figure 1.
A Sample View of Pigeonpea TACs, Markers, and Candidate ISR Markers onto Soybean Genome Sequence.
This image is from the SoyBase GBrowse viewer for soybean, at http://soybase.org/gb2/gbrowse, shows 200 kb from Gm10, starting from position 43 820 000. At a zoom level >2 Mbp, a heat map showing transcript density will be displayed. Assemblies for all 20 Gm chromosomes are displayed alongside regions of sequence homology in Cc. Red: there was at least one additional reported CcTA v2 alignment. Green: there were no other reported alignments.

