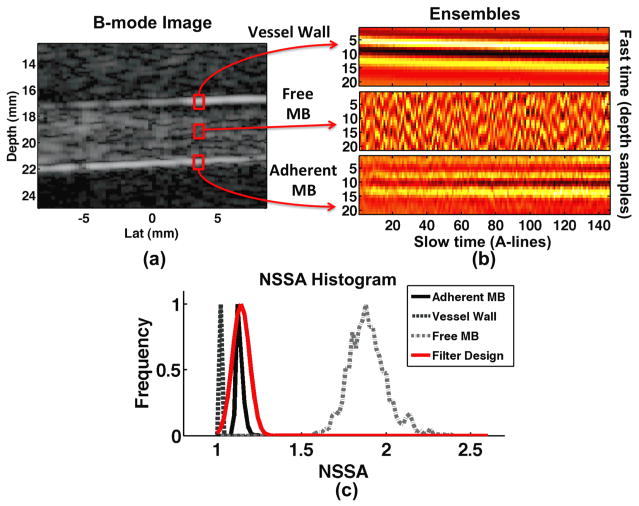
Figure 2.
Example in vitro phantom results illustrating vessel wall, free microbubble, and adherent microbubble signal component (a) location and (b) ensembles of un-processed echo data. (c) NSSA histograms from 0.2 mm × 5.1 mm regions of interest for each signal component. The weighting function, illustrated in red, is designed to span the NSSA expected from adherent microbubbles, illustrated in black.

