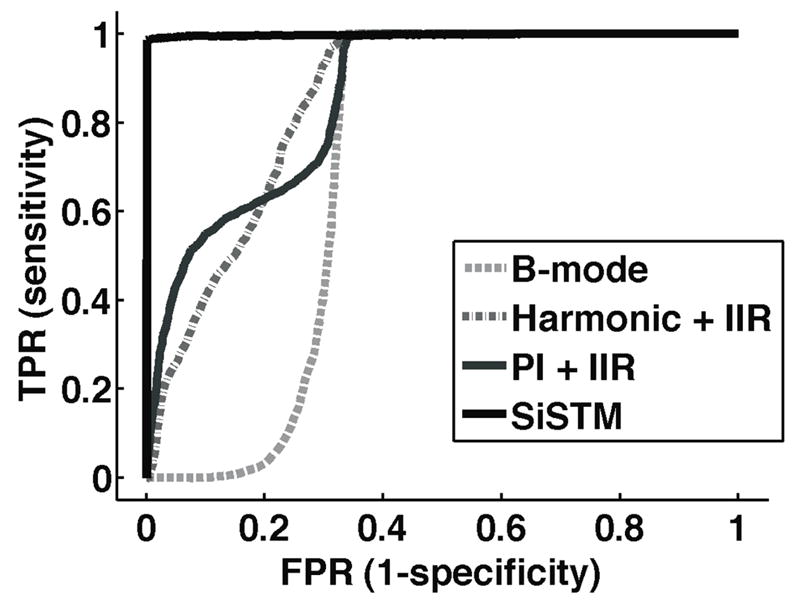
Figure 9.

Average ROC curves for B-mode, Harmonic + IIR, PI + IIR, and SiSTM imaging techniques. ROC curves were formed by first defining the adherent microbubble ROI as ‘true’ and all other component ROI as ‘false’. Next, the threshold at which a given pixel was classified as ‘true’ for adherent microbubble was varied between 500 dB and 0 dB at a 0.1 dB step size. Each point on the curve represents the true positive rate (TPR) and the false positive rate (FPR) measurement for the image ROI at each threshold value. Area under the ROC curve (AUC) derived from SiSTM results were significantly larger (p < 0.05) than alternative approaches.
