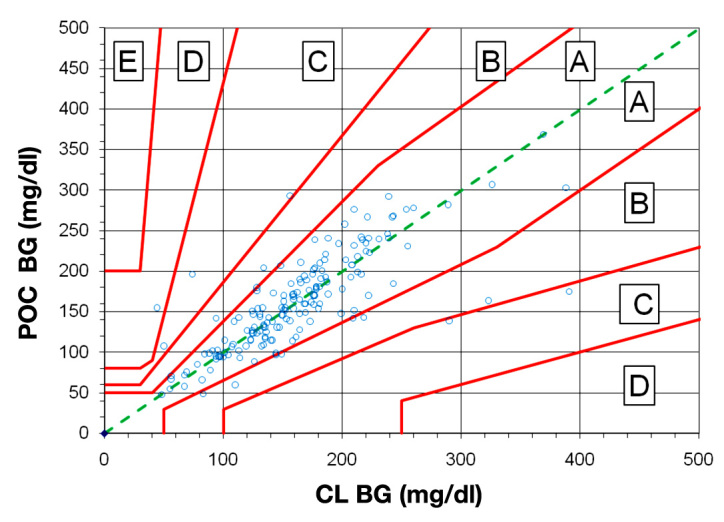
Figure 2.

Revised error grid analysis for 176 simultaneous point-of-care and central laboratory blood glucose values. The rEGA for type 2 diabetes patients was used. Point-of-care BG values are plotted on the y axis versus CL BG values on the x axis for simultaneous samples taken from the same site. The grid is divided into zones that represent the degree of risk created by each error: zone A represents no effect on clinical action; zone B represents altered clinical action with minimal effect on clinical outcome (170 patients together); zone C (5 patients) represents altered clinical action that is likely to affect clinical outcome; zone D (1 patient) represents altered clinical action that could result in significant medical risk; and zone E (no patients) represents altered clinical action that could have dangerous consequences. The ACCU-CHEK Inform glucose meter was used for all POC measurements.
