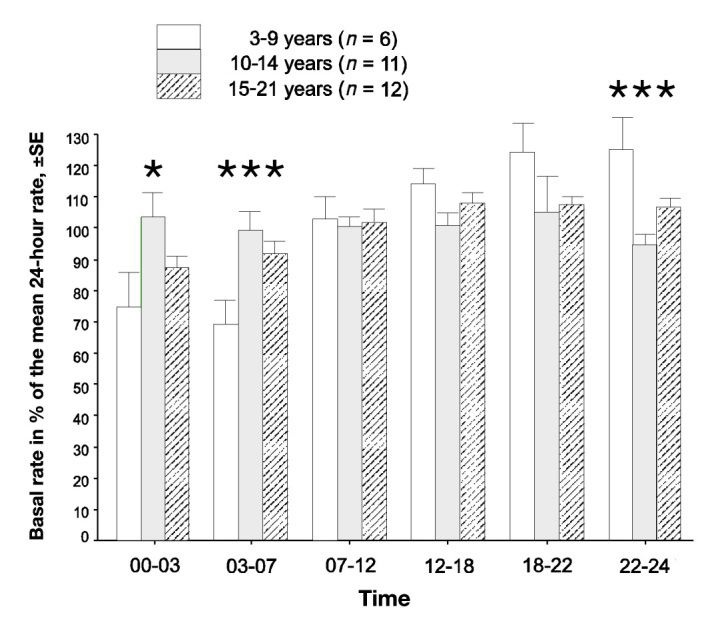
Figure 2.

Basal rates in the different age groups in relation to the mean hourly basal rate 1 year after pump start. The mean total basal rate per 24 h divided by 24 is defined as 100%. There was a significant difference in the distribution of the basal rate between the age groups during the night and the late evening (one-way analysis of variance). The asterisk represents p < .05, and three asterisks represent p < .001). SE, standard error.
