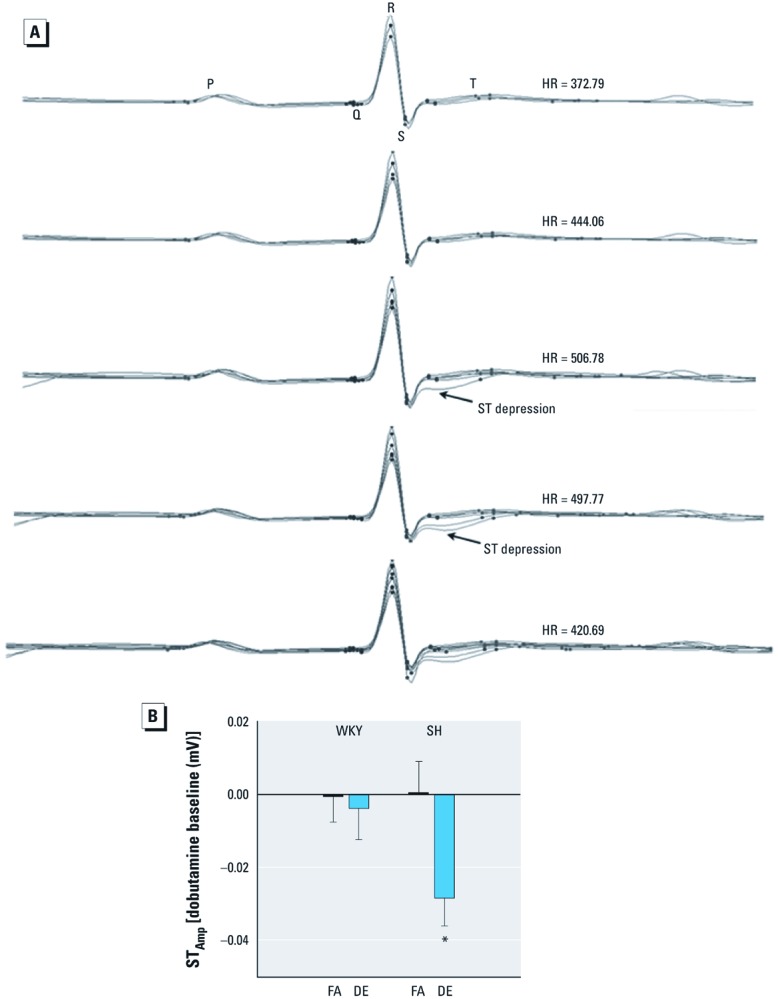
Figure 4.

SH rats develop ST depression at peak HRs during dobutamine challenge test. (A) Sample ECG waveforms (overlaid) from one of the DE-exposed SH rats show the development of ST depression as HR peaks at the highest dose of dobutamine; circles represent ECG segments (P wave, Q wave, R wave, S wave, T wave). (B) Changes in ST amplitude from baseline for WKY and SH rats exposed to FA and DE at peak HR during the highest dose of dobutamine in the challenge test. Values are presented as mean ± SE. *p < 0.05 compared with FA controls; n = 5–6.
