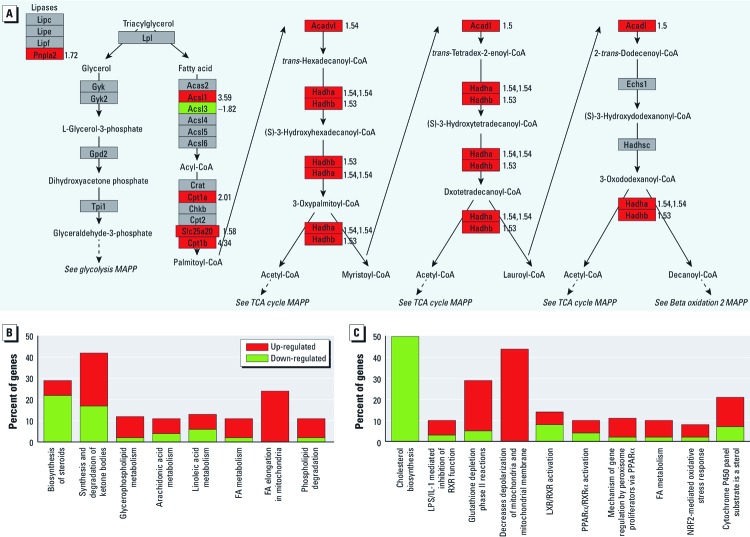
Figure 2.
DEHP treatment (50 µg/mL) up‑regulated genes associated with FAO and modifies lipid canonical and detoxification pathways. (A) Mitochondrial FAO pathway overlaid with mRNA expression fold change values (numbers to right of each gene). Up‑regulation (red) is indicated by a positive value, and down‑regulation (green) is indicated by a negative value. (B) Modified canonical pathways associated with lipid metabolism, and (C) modified detoxification pathways.

