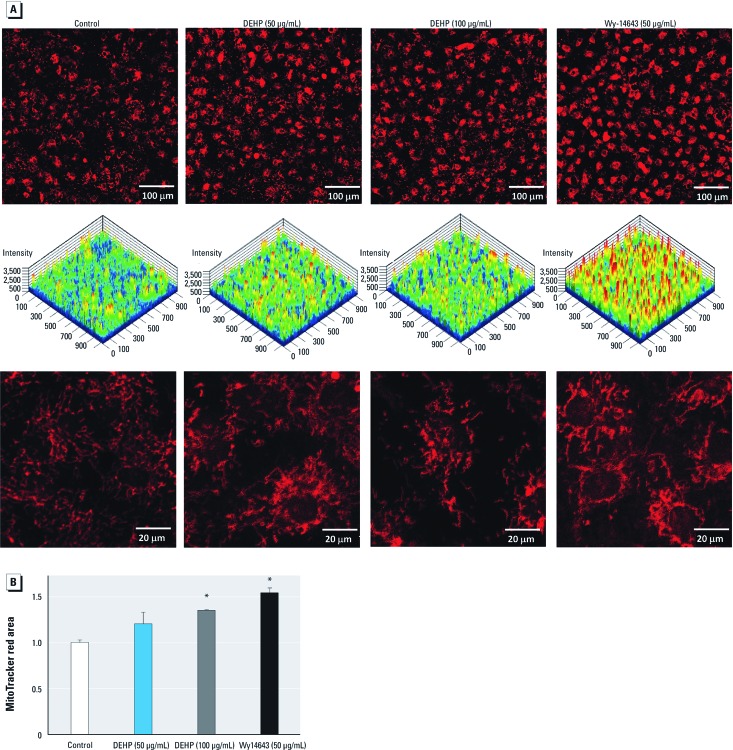
Figure 5.
DEHP and Wy-14643 treatment increased mitochondria mass. (A) Live imaging of cells loaded with MitoTracker red showed increased staining in DEHP (100 μg/mL) or Wy-14643 samples (20×; top). Images shown in (A) represented in 2.5-dimensional plots, with staining intensity shown in rainbow color (high intensity indicated by red and low intensity by blue; center). Cells were fixed to eliminate contraction movement (63×; bottom). (B) The area with total mitochondrial staining (mean ± SE) was larger in samples treated with DEHP (100 μg/mL) or Wy-14643 (50 μM) (n = 3). *p < 0.05 compared with the control.

