
Figure 7.
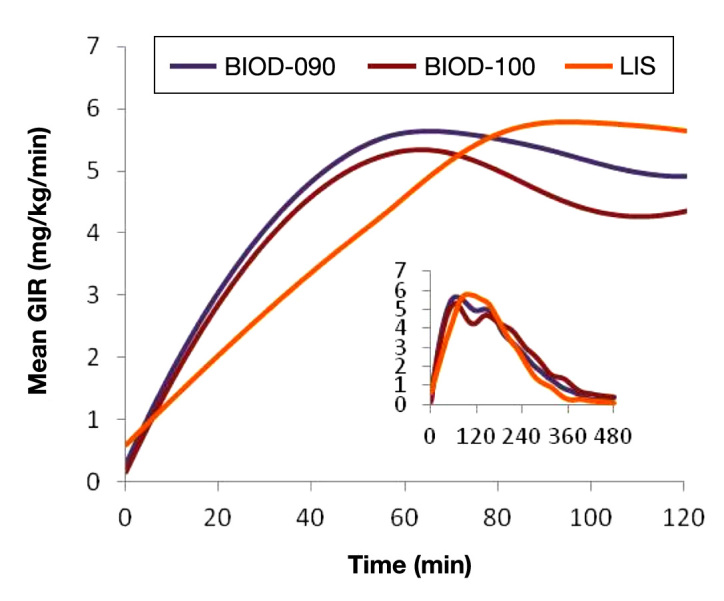
Mean PD curves for 12 U SC doses of BIOD-090, BIOD-100, and LIS in 40 patients with type 1 diabetes. The large figure shows the mean GIRs for the first 120 min after each injection. The inset shows the mean GIR curves for the entire 480-min observation period after each injection.