
Figure 9.
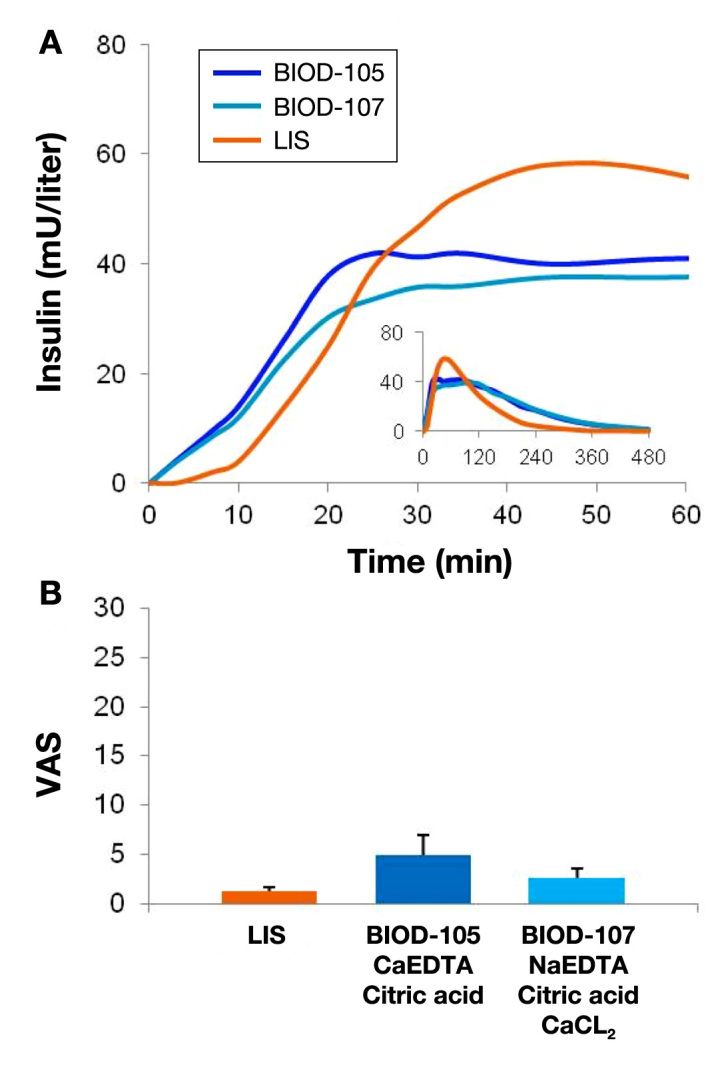
(A) Mean PK curves associated with 0.15 U/kg SC doses of BIOD-105, BIOD-107, and LIS in 18 patients with type 1 diabetes. (B) Toleration as measured on a 100 mm VAS from 0 (no discomfort) to 100 (worst possible discomfort) (mm). Mean ± SEM.