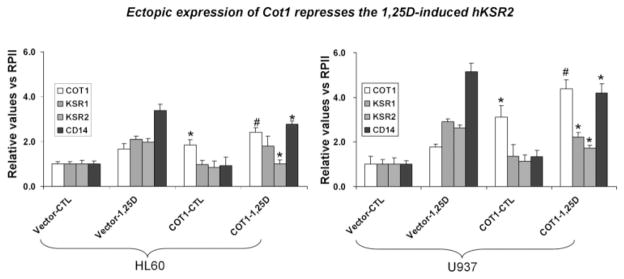
Fig. 6.
Ectopic expression of Cot1 represses the 1,25D-increased expression of KSR1, hKSR2, and CD14 mRNA. HL60 and U937 cells were stably transfected with empty vector or IRES-Cot1 constructs, then 1 nM 1,25D was added for 48 h, and mRNA expression of COT1, KSR1, KSR2, and CD14 (a differentiation maker) was determined by RT-qPCR. The values relative to the expression of RPII are presented as means ± SD (n = 3). P < 0.01, and denotes the statistical significance of the increases in Cot1 mRNA levels between transfected cells (Vector + 1,25D vs. Cot1 + 1,25D); P < 0.05 denotes the statistical significance of the decreases in Cot1 mRNA levels in the same comparison. n = 3.

