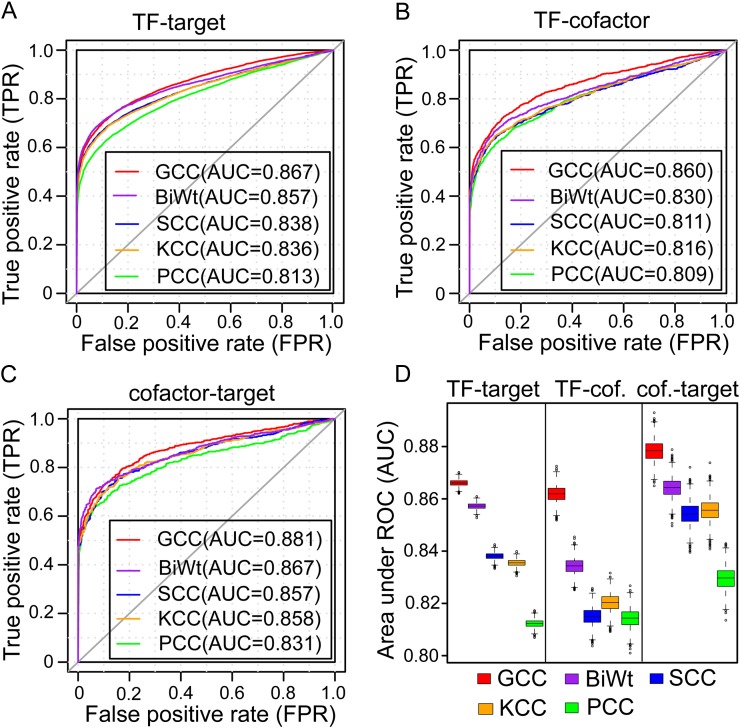
Figure 1.
Assessment of the overall performances of the five correlation methods evaluated by ROC analyses. A to C, The ROC curves were plotted for the GCC, PCC, SCC, KCC, and BiWt using the data sets of TF-target (A), TF-cofactor (B), and cofactor-target (C) gene pairs with a 1:1 ratio of positive and negative samples. D, Box plot of AUC values derived from the ROC analysis repeated 2,000 times. cof, Cofactor.

