Figure 6.
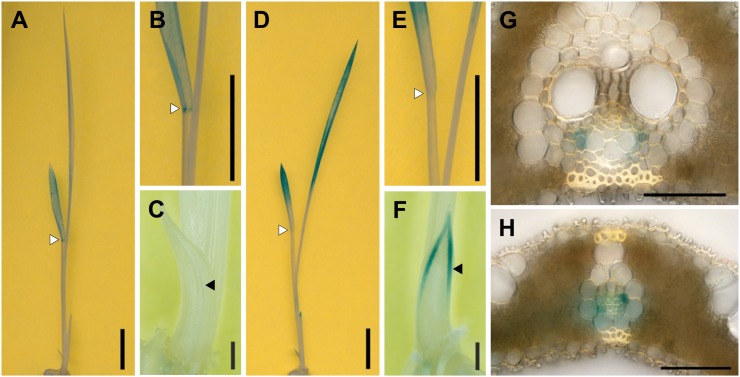
Distribution of GUS activity under the control of the 5′ upstream region of the cZOGT1 (A–C) and cZOGT2 (D–H) genes. A to F, Whole shoots of the transformants were stained for GUS activity. Overviews (A and D) and closeups of the laminar joint of the second leaves (B and E) and coleoptiles (C and F) are shown. Bars = 10 mm for A, B, D, and E and 1 mm for C and F. White and black arrowheads indicate laminar joints and vascular bundles of coleoptiles, respectively. G and H, Cross-sections of mature leaf blades; a large (G) and a small (H) vascular bundle are shown. Bars = 50 μm.

